Spectral Power Distribution

Light may be precisely characterized by giving the power of the light at each wavelength in the visible spectrum. The resulting spectral power distribution (SPD) contains all the basic physical data about the light and serves as the starting point for quantitative analyses of color. The SPD can be measured by a spectrophotometer. From the SPD both the luminance and the chromaticity of a color may be derived to precisely describe the color in the CIE system. Other systems of color measurement can also be related to the SPD. These systems have been successful in predicting color perception from the SPD, but it is not possible to proceed in the opposite direction. That is, the SPD cannot be predicted from the characteristics of the color as perceived by the human eye.

The SPD of light from an illuminated surface is the product of the percent reflectance of the surface and the SPD of the light which falls on the surface.

Example of SPD useCalculation of chromaticity
SPD example for common colors
Index

Vision concepts

Color vision

Color measurement

Reference
Williamson & Cummins
 
HyperPhysics***** Light and Vision R Nave
Go Back


Example of Spectral Power Distribution Application

You may buy an item of clothing under interior lighting and find that its color appears differently in outdoor light. The selection of makeup color may also be influenced by the interior light under which it is viewed. These effects may be quantified in terms of the spectral power distribution of the light under the different circumstances. The illustrations below depict the SPD curves for different interior fluorescent lighting.

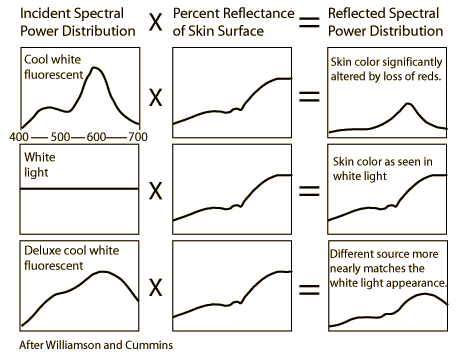
Williamson and Cummins cite General Electric Company Publication TP119, "Light and Color" for the data on the fluorescent lights.
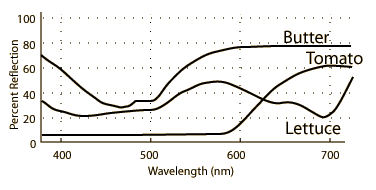
SPD example for common colorsCalculation of chromaticity
Index

Vision concepts

Color vision

Color measurement

Reference
Williamson & Cummins
Ch 2
 
HyperPhysics***** Light and Vision R Nave
Go Back


Example of Spectral Power Distribution Application

An example of the spectral power distribution of light from common objects shows that such colors arise from a range of wavelengths. Even the vivid red of a tomato involves a range of wavelengths in the red region of the visible spectrum.

After Williamson and Cummins, who cite General Electric Company Publication TP119, "Light and Color" for the data.

Spectral Power DistributionCalculation of chromaticity
Index

Vision concepts

Color vision

Color measurement

Reference
Williamson & Cummins
Ch 2
 
HyperPhysics***** Light and Vision R Nave
Go Back